
Trading in the stock market can often feel like navigating a maze. With various patterns and strategies, it’s easy to get lost. One of the most intriguing yet straightforward patterns that traders should know is the bull flag pattern. In this article, we’ll break down what a bull flag pattern is, how it forms, its significance, and tips for identifying it. Plus, we’ll briefly touch on how events like RBI bank holidays might affect trading strategies. So, let’s jump in, shall we?
What is the Bull Flag Pattern?
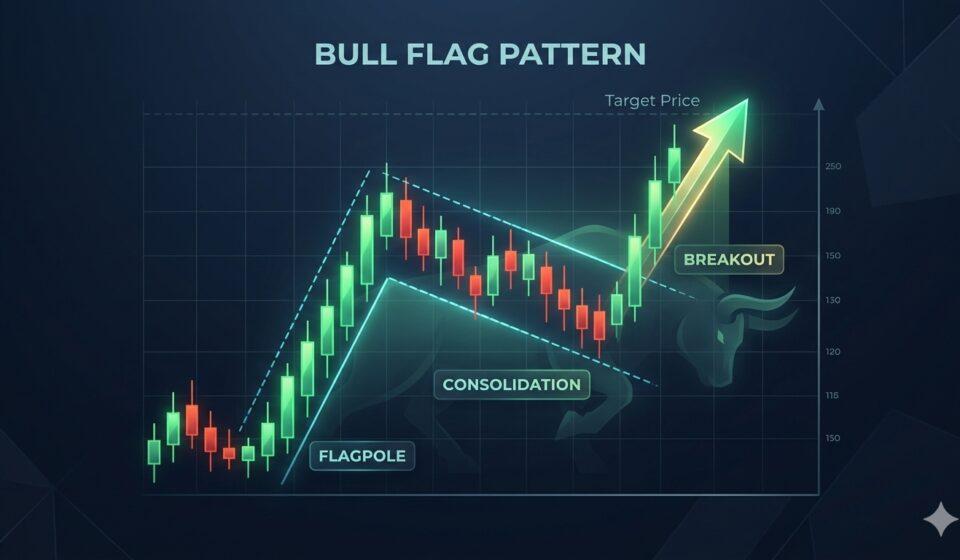
Imagine watching a movie where the hero faces tough challenges but ultimately emerges victorious. That’s what the bull flag pattern encapsulates in the trading world. It typically appears after a strong upward price movement (the flagpole) followed by a brief period of consolidation (the flag), and finally culminates in a breakout to continue the upward trend.
Think of a bull flag as a resting period for a fighter. After a robust performance, a bit of a break is often required before launching into action again. This pattern indicates bullish sentiment, suggesting that buying pressure may soon dominate once again.
How Does the Bull Flag Pattern Form?
Every good story has a beginning, middle, and end. The same goes for the bull flag pattern. Let’s break it down into three key stages:
1. The Flagpole: This part of the pattern represents a rapid price increase. Picture someone sprinting—it’s fast, exhilarating, and builds anticipation. The price rises sharply, leaving traders excited.
2. The Flag: After the adrenaline rush of the flagpole, the price cools down. Here, it consolidates, and you may see lower highs and higher lows resembling a flag shape. This is where the stock takes a breather before making a move.
3. The Breakout: After the flag formation, the price typically breaks out upward, indicating a continuation of the trend. This moment can feel like the tension building in a good film right before the climax.
Why is the Bull Flag Pattern Important?
Understanding the bull flag pattern can be a trader’s best friend. It signals potential buying opportunities, helping traders recognize when to enter the market. When seen correctly, this pattern can yield profitable trades and contributes to a well-informed trading strategy.
Traders use the bull flag pattern for its high probability of success. People often remember the golden rule of trading: buy low and sell high. The bull flag pattern aligns perfectly with this philosophy, paving the way for profitable trading.
How to Identify a Bull Flag Pattern
Identifying the bull flag pattern isn’t rocket science, but it does take a bit of practice. Here are key factors to look for:
1. Price Movement: First, you need that strong upward movement—this forms your flagpole. Look for a rapid price increase over a relatively short period. If you see a strong price spike on high volume, you’re already on the right track.
2. Consolidation Phase: Next up, look for the flag itself. You want to see a downtrend that follows the flagpole. It should look like a rectangle or a triangular shape—and it’s often important that the price doesn’t drop too far from the pole.
3. Breakout Confirmation: Finally, watch for the breakout. A breakout occurs when the price moves above the upper boundary of the flag on increased volume. This is your signal to act!
The Role of Volume in Bull Flag Patterns
Volume can be some seriously defining factor in any trading pattern, and the bull flag pattern is no different. The volume accompanying the formation of the flagpole should ideally be high, confirming that traders are rallying behind the price move.
During the flag formation, volume might taper off, suggesting that traders are taking a breather. But when the price breaks out above the flag, you’ll want to see a surge in volume again. This uptick signifies renewed interest, bolstering your confidence in the bullish trend.
Common Pitfalls to Avoid
Every hero has a weakness, and traders have their pitfalls. Here are a few to watch out for when you’re dealing with the bull flag pattern:
1. Ignoring Other Indicators: Don’t put all your faith in a single pattern. Use other technical indicators to strengthen your prediction. If the chart is screaming buy, yet other factors conflict, be cautious!
2. Chasing the Breakout: It’s tempting to jump in early, especially when you’re filled with excitement. However, ensure you wait for confirmation of the breakout. Jumping in too early can lead to unwanted losses if it reverses.
3. Overconfidence: Just because you identify a bull flag pattern doesn’t mean it will always lead to a breakout. Market dynamics can be unpredictable. Stay grounded and diversify your investments.
Trading Strategies with the Bull Flag Pattern
Once you identify the bull flag pattern, you can employ several strategies. Here’s a brief look at a couple of popular methods:
1. Buying on the Breakout: A popular strategy is to enter a trade as the price breaks above the flag. Set a stop-loss order just below the flag in case things don’t go as expected. This way, you minimize your risk.
2. Setting Price Targets: A useful tactic is to set price targets based on the length of the flagpole. After identifying the flagpole length, project that upward from the breakout point. This gives you an idea of where the price might head next—your target!
What About RBI Bank Holidays?
Now, as we venture into the larger market landscape, it’s essential to consider external factors like RBI bank holidays. While this may seem unrelated, it can affect liquidity in the market. On holidays, especially during significant economic announcements, trading volume can fluctuate.
When you’re trading patterns like the bull flag pattern, keep an eye on calendar events. If you know that a RBI bank holiday is approaching, you might want to adjust your strategies accordingly. Avoid entering new positions right before holidays, as volatility can lead to unpredictable movements.
Conclusion: Embrace the Bull Flag Pattern
In conclusion, the bull flag pattern is a powerful tool in every trader’s toolbox. Its identifiable formation and meaning offer great opportunities for anyone willing to pay attention. Just as a good book keeps you on your toes, this pattern allows you to engage in smart trading.
Remember, as you embark on your trading journey, combine technical analysis with sound strategies and awareness of market fluctuations—like RBI bank holidays. So, go ahead, keep your eyes peeled for that bull flag pattern, and watch your trading story unfold. Happy trading!
Read also:- Upcoming Dividend Stocks: Important Dates and Details Investors Should Track